Not an official ACM page
[Problem C
| 1993 ACM finals problem set
| My ACM problem archive
| my home page]
1993 ACM Scholastic Programming Contest Finals
sponsored by AT&T EasyLink Services
Problem B
Classifying Lots in a Subdivision
A subdivision consists of plots of land with each plot having a
polygonal boundary. A surveyor has surveyed the plots, and has given
the location of all boundary lines. That is the only information
available, however, and more information is desired about the plots in
the subdivision. Specifically, planners wish to classify the lots by
the number of boundary line segments (B=3,4,5,...) on the
perimeter of the lots.
Write a program that will take as input the surveyor's data and
produce as output the desired information about the nature of the lots
in the subdivision.
Input
The input file consists of several data sets. Each data set begins
with a line containing the number of line segments (4 <= N
<= 200) in the survey. The following N lines each contain
four integers representing the Cartesian (x,y)
coordinate pairs for the N points of a boundary line
segment. The input file is terminated with a 0.
Output
For each data set, provide output listing the number of lots in each
classification of boundary line segment counts
(B=3,4,5,...). Do not include in your output those cases in
which the classification has no members. The output for each data set
will begin with a line containing an appropriately labeled data set
number. Output for successive data sets will be separated by a blank
line.
Assumptions:
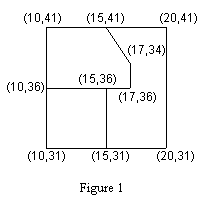
- Each data set corresponds to a rectangular subdivision (as in
Figures 1 and 2). The boundaries of the rectangular subdivision are
parallel to the x and y axes.
- All coordinates in the input file are positive integers in the
range 1 to 10000.
- Boundary line segments in the input file do not extend past
corners of lots. For example, in Figure 1 the surveyor must survey
from the point (10,41) to (15,41) and from (15,41) to (20,41) rather
than surveying the entire line (10,41) to (20,41).
- At least one boundary line segment in each lot lies on the
subdivision’s bounding rectangle.
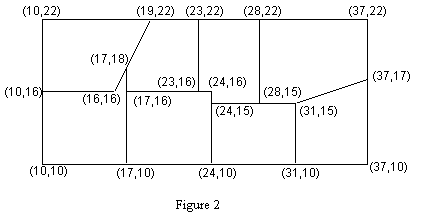
Figures 1 and 2 show two hypothetical subdivisions. In Figure 1 there
are 12 boundary line segments, and in Figure 2 there are 27. The
sample input file below contains the data for these two test
cases. The plot in the upper left hand corner of Figure 2 has one line
running from (16,16) to (17,18) and another from (17,18) to
(19,22). Thus this lot has a perimeter comprised of 5 boundary line
segments, though geometrically the lot is a 4-sided region. Similarly
the perimeter of the plot in the upper left hand corner of Figure 1 is
comprised of 6 boundary line segments, though the lot is pentagonal in
shape.
Sample Input
12
10 41 15 41
15 41 20 41
10 36 15 36
15 36 17 36
10 31 15 31
15 31 20 31
10 41 10 36
10 36 10 31
15 41 17 34
17 34 17 36
15 36 15 31
20 41 20 31
27
10 22 19 22
19 22 23 22
23 22 28 22
28 22 37 22
10 16 16 16
17 16 23 16
23 16 24 16
24 15 28 15
28 15 31 15
10 10 17 10
17 10 24 10
24 10 31 10
31 10 37 10
10 22 10 16
10 16 10 10
17 18 17 16
17 16 17 10
24 16 24 15
24 15 24 10
23 22 23 16
28 22 28 15
31 15 31 10
37 22 37 17
37 17 37 10
16 16 17 18
17 18 19 22
31 15 37 17
0
Output for the Sample Input
Case 1
Number of lots with perimeter consisting of 4 surveyor's lines = 1
Number of lots with perimeter consisting of 6 surveyor's lines = 1
Number of lots with perimeter consisting of 7 surveyor's lines = 1
Total number of lots = 3

Case 2
Number of lots with perimeter consisting of 4 surveyor's lines = 1
Number of lots with perimeter consisting of 5 surveyor's lines = 4
Number of lots with perimeter consisting of 6 surveyor's lines = 3
Total number of lots = 8
This page maintained by Ed Karrels

Last updated February 12, 2010